MELT-B: An AI-Powered Web Platform That Turns Thermal Imagery into Building Energy Insights

The Challenge

Buildings account for nearly 40% of global energy consumption, so identifying the ones that leak the most heat is a massive opportunity for governments, utilities, and construction firms. The real blocker is data. Traditional energy audits depend on sending inspectors to each site with a thermal camera (a camera that sees heat instead of visible light), one building at a time. It is slow, expensive, and impossible to scale to an entire city, let alone a country.

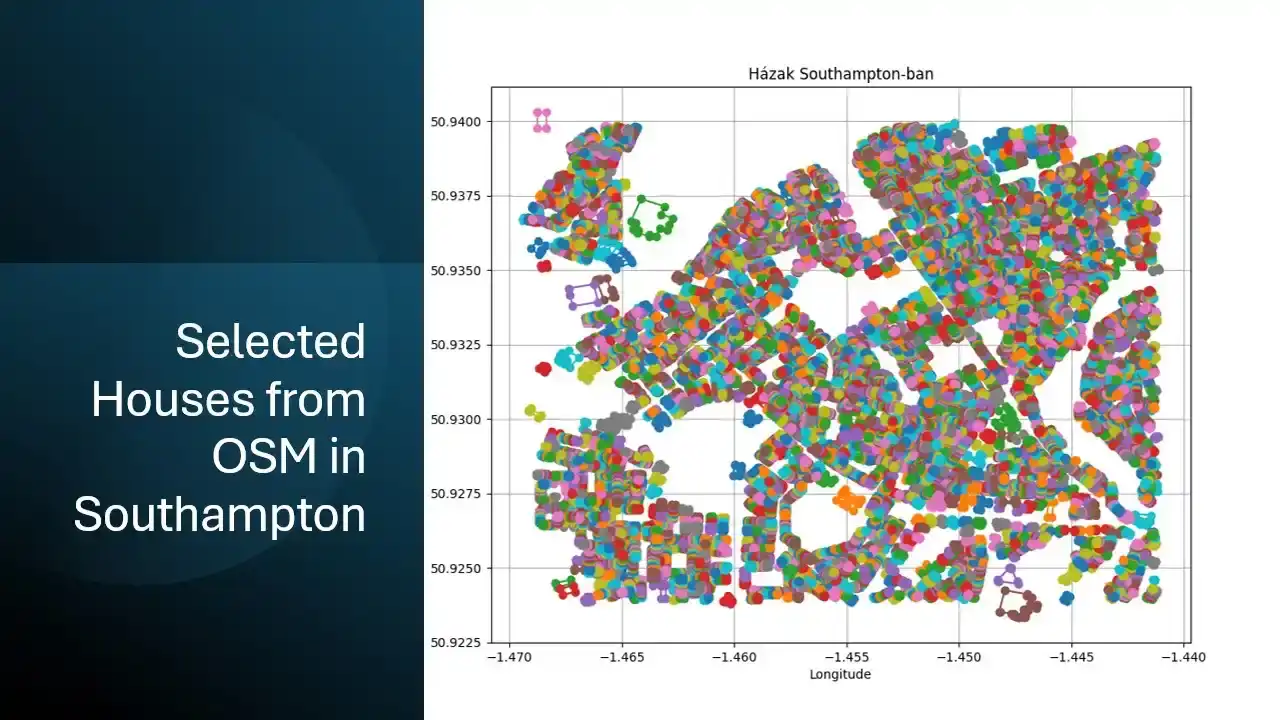
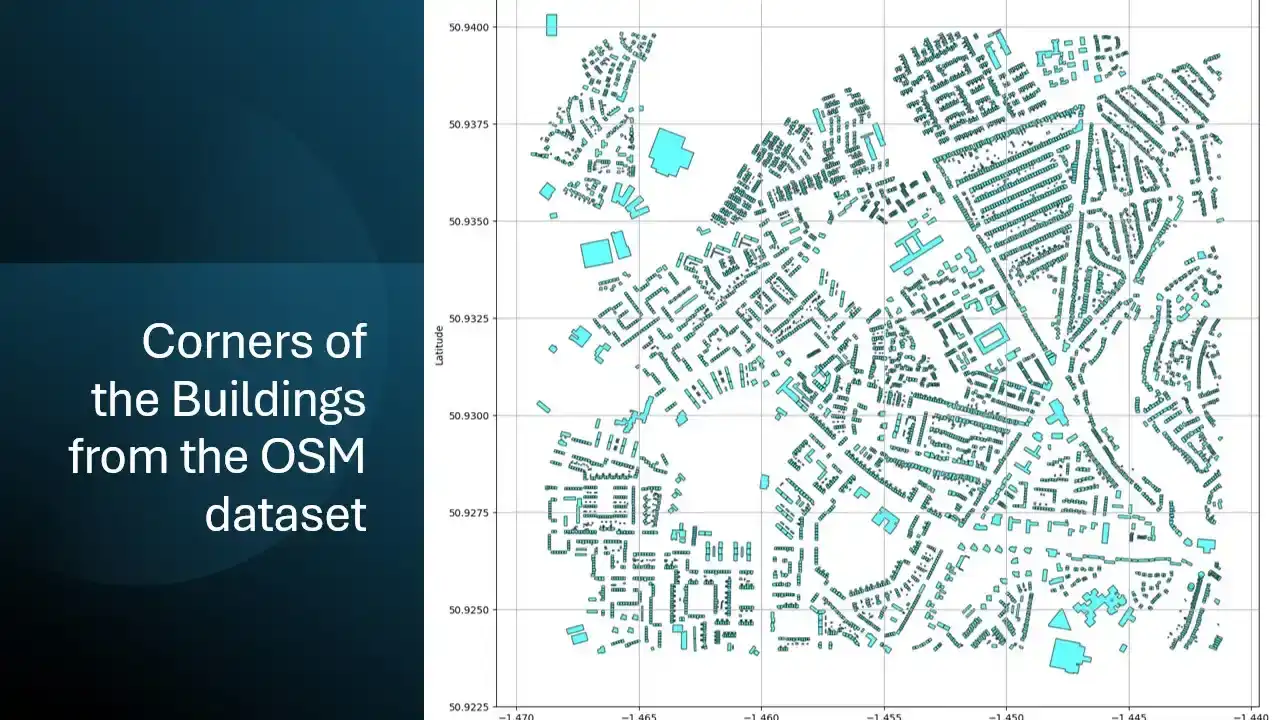
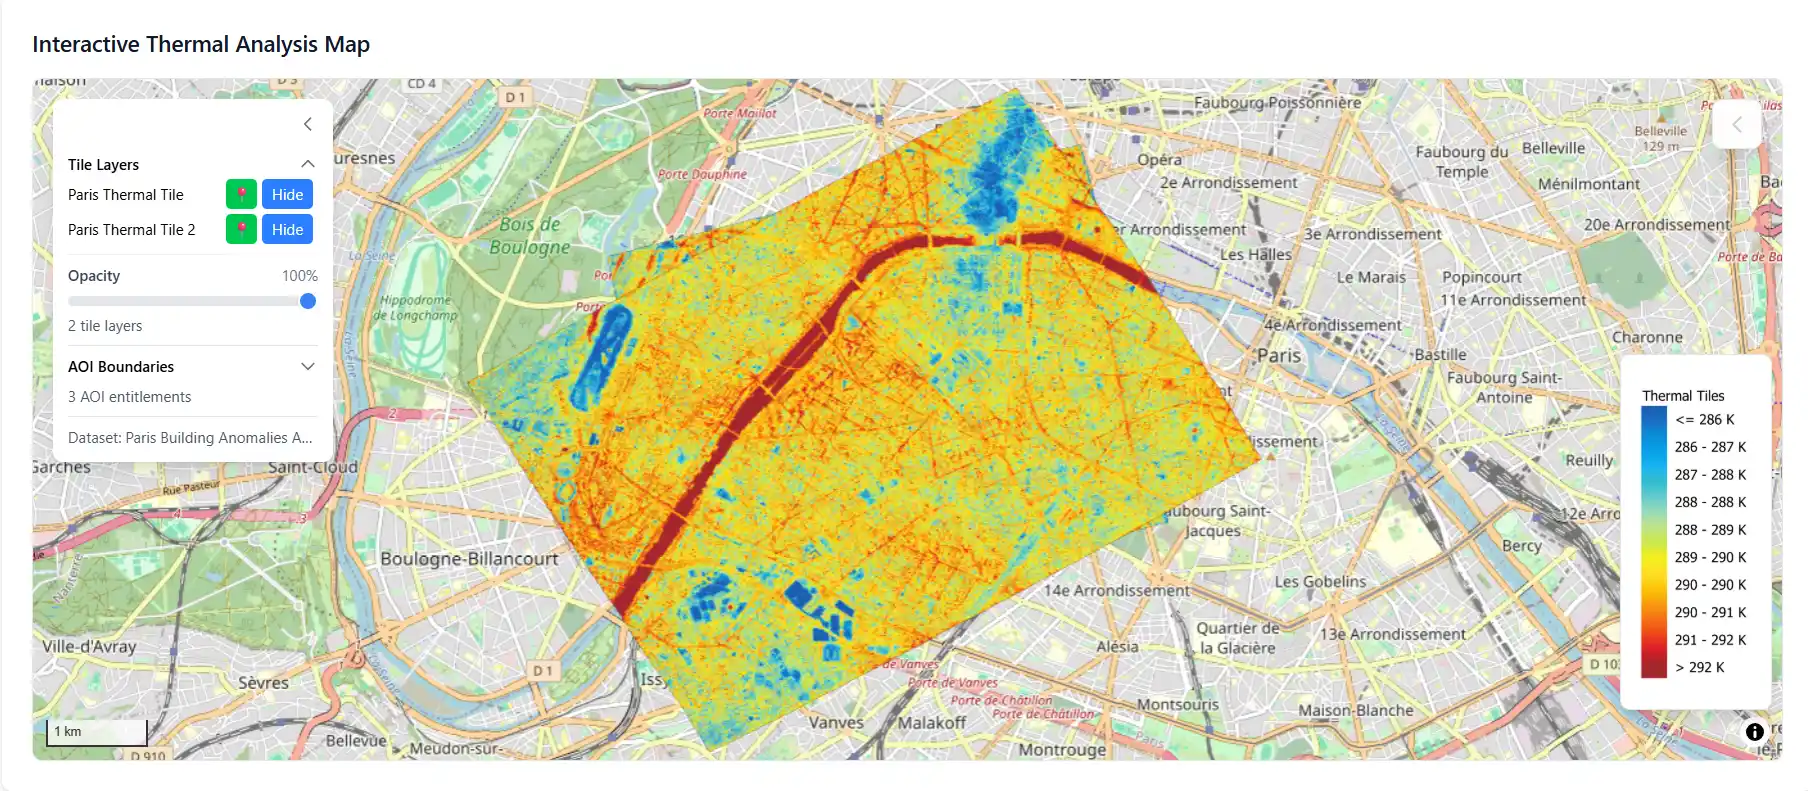
ESA wanted a fundamentally different approach: instead of visiting buildings, use thermal images captured from orbit (from sensors mounted on satellites high above Earth) and let software do the analysis. The raw imagery, however, is huge, noisy, and geographically complex; a thermal pixel on its own cannot tell you which building it belongs to, how big that building is, or what it is made of. The real problem was therefore a software engineering and data science one: build a reliable pipeline and AI system that can ingest terabytes of imagery, match every pixel to a specific building in a city-wide database, estimate that building's heat loss, and serve the results through a web application that non-technical users (city planners, renovation companies, materials suppliers) can actually work with.

MELT-B web dashboard showing building-level heat loss across a city

The Solution

MELT-B (short for Monitoring, Estimating, and Simulating Loss of Thermal Energy in Buildings) is the end-to-end cloud platform we built to solve this. On the data engineering side, we designed an automated pipeline on AWS: thermal imagery lands in S3 (Amazon's object storage service), Lambda functions (small pieces of code that run automatically when new data arrives) trigger the processing jobs, and the results are written into a PostgreSQL database extended with PostGIS. PostGIS adds geographic capabilities to an ordinary relational database, so we can run queries like 'find every building in this neighbourhood whose heat loss is above the city average' directly in SQL. Building footprints, energy certificates, construction materials, and other metadata are pulled from public registries and joined against the imagery in that same database, giving every building a rich, queryable profile.

On the AI side, we trained computer vision models in PyTorch and TensorFlow, served through AWS SageMaker (Amazon's managed machine learning service), to do two jobs. First, segmentation: identify which pixels in a thermal image belong to which individual building, a non-trivial problem because rooftops, shadows, neighbouring structures, and roads all interfere with the signal. Second, estimation: predict each building's heat loss from the thermal signal combined with its metadata, and flag the worst offenders. The output is exposed through a REST API and visualised in a React web dashboard where users can pan around a city, click on any building, and see its estimated energy performance, CO₂ footprint, and renovation priority. For GIS specialists (people who work with map-based data), the same layers can be loaded directly into tools like QGIS. The whole stack is version-controlled on GitHub and deployed through CI/CD, so every change is tested and released automatically.

MELT-B cloud data pipeline on AWS, from image ingestion through AI segmentation to PostGIS database

The Result

Pilot deployments in Debrecen (Hungary) and Southampton (UK) showed that the platform can process a full city's worth of thermal data and produce per-building heat loss estimates in hours rather than months, at a fraction of the cost of manual audits. City planners can now open the web dashboard, sort their building stock by estimated heat loss, and generate targeted renovation plans backed by real data. Because everything runs on a serverless AWS architecture, the same software can be pointed at a new city with minimal reconfiguration; adding a new region is a configuration change, not a rebuild. What began as a specialist space research project has become a general-purpose, AI-driven data platform for urban energy management, demonstrating how modern web, database, and machine learning engineering can unlock value that was previously hidden in raw satellite data.

Building-level energy analytics dashboard with heat loss metrics and renovation priorities

Project tech stack

React JavaScript library

React

Amazon Web Services (AWS) cloud platform

Amazon Web Services (AWS)

TensorFlow machine learning framework

TensorFlow

PyTorch machine learning framework

PyTorch

GitHub version control platform

Github

QGIS geographic information system

QGIS

Long-term wins

A scalable data platform that can be rolled out to any city without rebuilding the pipeline
Clear, data-driven guidance on which buildings to renovate first, with measurable energy savings
Lower energy waste and CO₂ emissions, supporting climate goals through evidence rather than guesswork